Receiver sensitivity is the strength of the weakest signal that a radio receiver can detect and demodulate. It is typically specified in dBm, Watt or microvolt.
It is also referred to as Minimum Detectable Signal (MDS).
It is an important parameter in wireless communication system planning. This is the target signal strength number that has to be achieved for the system to work.
How to Calculate Receiver Sensitivity
Use this tool is used to calculate the sensitivity.
Enter the following:
- Temperature
- Bandwidth
- Receiver Noise Figure
- Signal to Noise ratio required to achieve the desired performance
Receiver Sensitivity Formula
Receiver Sensitivity = 10 * log10 (kTB/(1 mW)) + NF + SNR
Where
- T – Temperature
- B – Bandwidth
- k – Boltzmann’s Constant 1.380649 × 10⁻²³ m2 kg s-2 K-1
- NF – Noise Figure
- SNR – Signal-to-Noise ratio (sometimes referred to as Carrier-to-Noise Ratio or CNR)
Receiver sensitivity can also be expressed as a function of Noise Floor:
Receiver Sensitivity = Receiver Noise Floor + SNR
Noise Figure
Noise figure degrades the receiver sensitivity. Typically a low noise amplifier can be used to improve or lower the minimum detectable signal level.
Signal-to-Noise Ratio
As the complexity of the modulation increases the required SNR increases as well. Frequency Modulation (FM) signals for instance require lower SNR than Bluetooth which is a more complex digital waveform.
Temperature
As the operating temperature increases, the noise power increases. This degrades the receiver sensitivity
Bandwidth
The larger the bandwidth, the higher the noise power in the band of interest. This in turn degrades the receiver sensitivity.
Frequently Asked Questions
What is maximum and minimum receiver sensitivity?
The sensitivity of a receiver depends on noise figure and signal to noise ratio based on the formula: 10 * Log10 (kTB/(1 mW)) + NF + SNR
While the SNR for a particular modulation scheme is fixed, the Noise Figure varies. It depends on the NF of the first LNA in the receive chain. The plot below shows the NF variation of an amplifier both with device voltage and frequency. It will also vary with temperature.
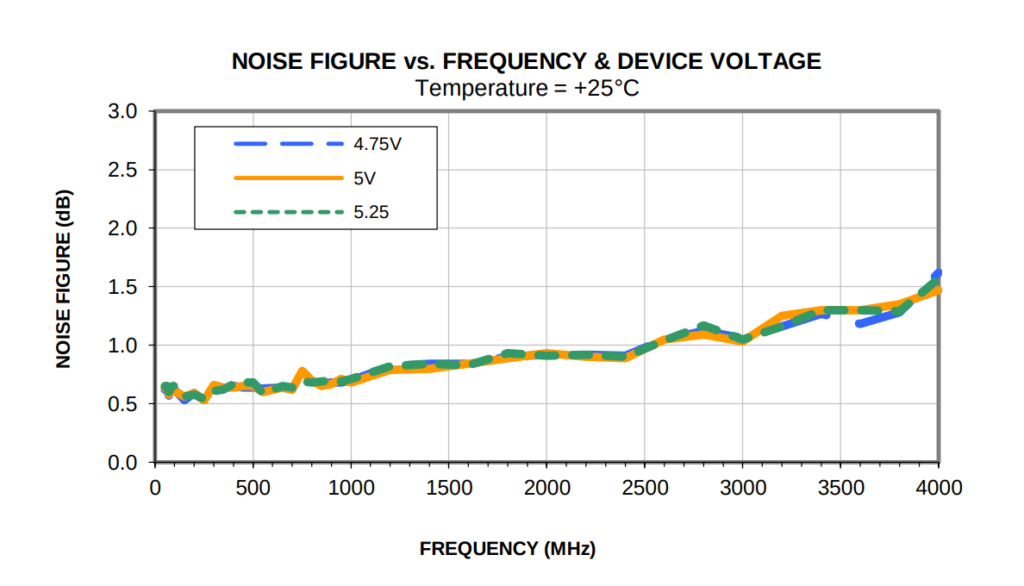
The maximum sensitivity corresponds to the highest value of noise figure while the minimum sensitivity depends on the lowest value of NF.
What is the relationship between receiver sensitivity and bandwidth?
The sensitivity is given by the following equation:
Receiver Sensitivity = 10 * log10 (kTB/(1 mW)) + NF + SNR
As the bandwidth B increases, the sensitivity number increases and therefore the receiver becomes less sensitive. (E.g. when the receiver sensitivity goes from -90 dBm to -60 dBm, it has become less sensitive).
A ten fold increase in bandwidth – for example from 10 kHz to 100 kHz – reduces the sensitivity by 10 dB.
To maximize the receiver’s ability to detect a signal it’s important to reduce the bandwidth as much as possible.
How does Sensitivity impact Range?
Using the antenna distance calculator, a 3 dB improvement in sensitivity improves the range by over 40% in free space.
| Sensitivity (dBm) | Range (km) |
|---|---|
| -97 | 120 |
| -100 | 169 |
Antenna Gain:
- Frequency of operation: 1 GHz
- Tx and Rx Antenna Gain: 10 dBi
- Transmit Power: +10 dBm
- Cable Loss: 3 dB
How to Calculate Receiver Sensitivity
Here is an example calculation
At:
- Room temperature 27oC or 300 K,
- Signal bandwidth of 25 kHz,
- Receiver noise figure of 5 dB,
- Required SNR of 4 dB,
results in a Receiver Sensitivity or minimum detectable signal level of -121 dBm.
In other words, a signal has to be at least -121 dBm to be demodulated by the receiver.